One of the things pet startup founders struggle with, time and time again, is how to calculate their TAM, SAM, & SOM accurately. The Total Addressable Market, Serviceable Addressable Market, and Service Obtainable Market are key data points to determine who you’re aiming to reach with your product and how much revenue you can expect.
If you want to get these right so your pitch deck shines, you’re in the right place.
By the end of this article, you’ll learn:
- What is TAM, SAM, and SOM?
- Why do TAM, SAM, and SOM matter?
- How to calculate your Total Addressable Market (TAM)?
- How to calculate your Serviceable Addressable Market (SAM)?
- How to calculate your Service Obtainable Market (SOM)?
- Resources for determining market size in the pet industry.
Sound good? Let’s start with definitions.
*Note: All numbers used in this article are examples, unless a source is linked.
What is TAM, SAM, and SOM?
Let’s start with definitions.
Total Addressable Market (TAM) = the maximum revenue potential if your pet startup owned 100% of the available market. This ignores competitors and (typically) geographical constraints.
Serviceable Addressable Market (SAM) = the slice of the TAM that your pet business can serve with its products and services.
Service Obtainable Market (SOM) = the realistic market share your pet startup can achieve considering competition, geographical constraints, operational limitations, and so on.
Why do TAM, SAM, and SOM matter?
Here’s why knowing the TAM, SAM, and SOM is vital to any pet startup:
- Assess your market potential: Every pet startup founder should know the full potential of their business to help them make key decisions in business development, both short term and long term.
- Attract investors: Investors, venture capitalists and startup accelerators want to know your market potential before making their decision to work with you. That said, a wildly unrealistic TAM can turn off investors quickly. It’s important to find the Goldilocks zone.
- Determine potential for new markets: You can also use these calculations before launching new products or entering new markets to estimate potential market size and ROI.
- Analyse your competitive position: Use this data to figure out your place in the pet market when compared to leading competitors.
- Develop better marketing strategies: Your go-to-market strategy will shift depending on the vertical and customer type you’re trying to attract. Therefore, figuring out the size of the specific market you’re aiming for helps you choose appropriate marketing methods and measure your success.
Calculating your TAM, SAM and SOM is a skill that you can use throughout your startup’s life.
So let’s dive into the step-by-step calculations.
How to calculate your Total Addressable Market (TAM)?

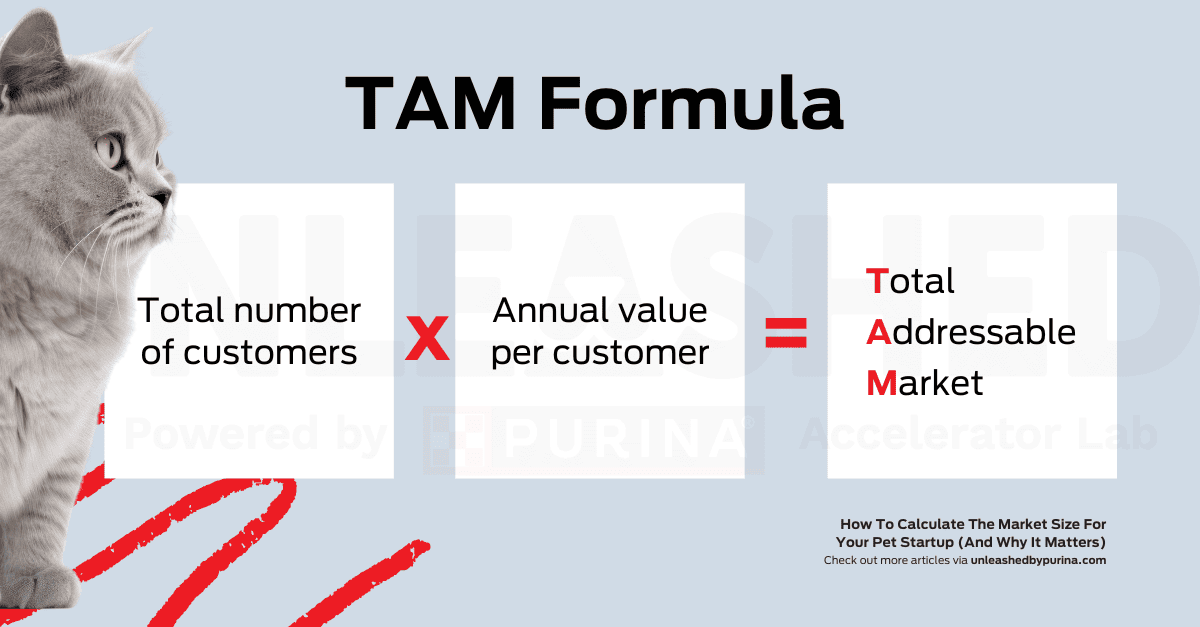
The formula for calculating TAM is:
Total number of customers + Annual value per customer = Total Addressable Market.
When considering the total number of customers, it’s tempting to say your market includes every pet parent on the planet.
For example, let’s say you want to launch a pet camera company in Sweden.
The global pet population is around 1 billion in 500 million households. Assume that our Swedish pet camera company charge €200 for their cameras.
500 million pet-owning households x €200 pet camera = TAM of €100 billion.
While your TAM may be in the billions, it’s unlikely that your realistic TAM is every pet household in the world. In fact, that might not even be your goal. It’s worth doing a more detailed analysis of the market size to make your estimates more tangible.
There are two ways to look at this:
Top down-approach to calculating your TAM
Top-down calculations involve looking at broader market data and then estimating your company’s target market segments within that data.
Then, multiply this number by the price of your product or an industry average.
For example, if there are approximately 500 million pet owners in the world and industry reports show the average cost of a pet camera worldwide is $250:
500 million x $250 = TAM of $125 billion.
As you can see, this approach still has its flaws. The bottom-up approach is deemed to be more accurate.
Bottom-up approach to calculating your TAM
For a bottom-up approach, start by collecting your own data on the market segment your product appeals to the most.
Example: during their market research, our Swedish pet camera company figured out that, primarily, dog owners are interested in their cameras. They also found a report that shows that dog owners spend $300 on average on pet tracking tools like cameras.
Therefore, the TAM calculation would be:
Dog owners X Price = TAM.
223 million X $300 = TAM $66.9 billion.
Of course, this approach is much more labour-intensive but creates a better picture for you and your potential investors.
How to calculate your Serviceable Addressable Market (SAM)?

With the Serviceable Addressable Market, we are narrowing our scope even further.
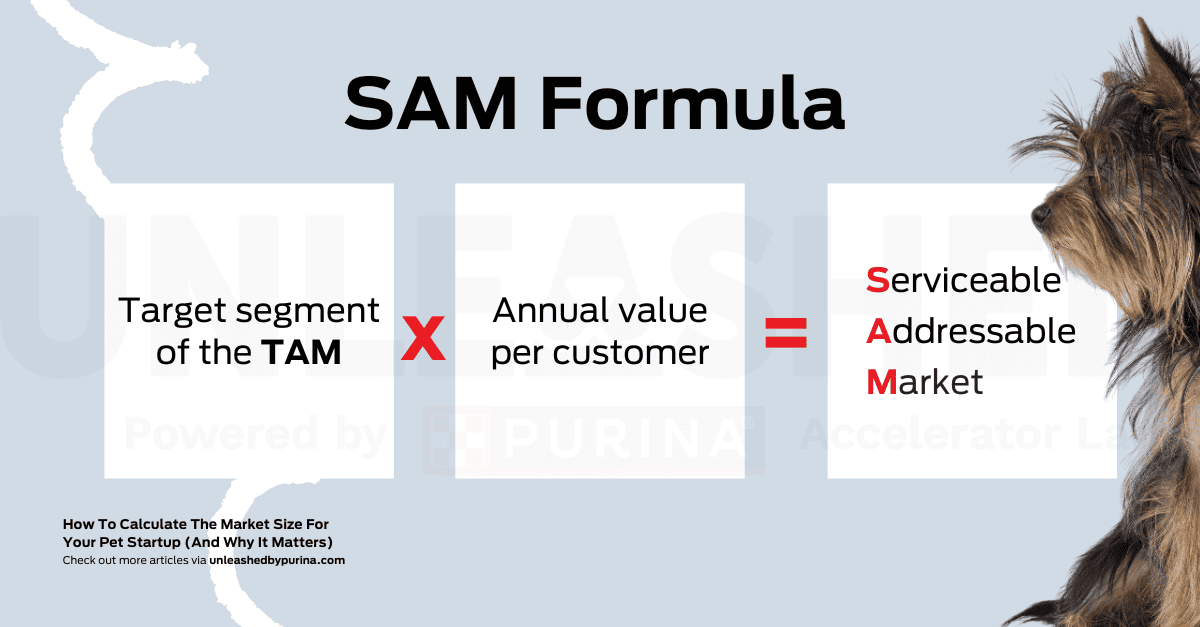
The formula for calculating the SAM is:
Target segment of the TAM x Annual value per customer = Serviceable Addressable Market.
The big question here is who is a good fit for your pet startup?
A bottom-up approach is the best way to figure this out.
Let’s say our Swedish pet camera company discovers that tech-savvy millennial dog owners in Europe are their primary market. Therefore, their audience is between the ages of 29 and 42, and they estimate around 30% of those people are concerned enough to purchase a pet camera.
The founders surveyed some of their target audience and found they would be willing to pay €200 for their specific pet camera.
Target pet-owning households in Europe × Price of the pet camera = SAM.
22.5 million x €200 = SAM €4.5 billion.
How to calculate your Service Obtainable Market (SOM)?

Figuring out your SOM is the hardest of all.
If you’ve been in business for at least one year, you can calculate your SOM as follows:
Last year’s market share x This year’s SAM = Service Obtainable Market.
Example:
If last year’s SAM was €4.5 billion and you made €4.5 million, your market share was 0.1%.
This year, your SAM is €5 billion.
€5 billion x 0.001 = SOM of €5 million.
Simple enough, right? However, if you’re a new pet startup, you have to be a little more subjective.
Think about the following factors:
- Specific target audience
- Initial geographical limitations
- Average or predicted conversion rate
- Predicted market growth
- Budget constraints
- Production capacity
- Your unique USP
For instance, the Swedish pet camera company may start their business focusing only on Nordic countries due to operational constraints. Assume that 20% of pet-owning households in the Nordic countries are tech-savvy millennial dog owners. They expect to capture 5% of their niche market.
Reachable dog-owning households in the Nordics × Market share × Price of the pet camera = SOM
(10,000,000×0.20×0.05)×200 = €20 million
As you can see, this is by no means perfect, but the more granular you get with your research, the better.
Resources for determining market size in the pet industry
Now, there has been a lot of discussion around collecting data to get these numbers right.
What are the best sources to use? Here’s a quick guide:
- Market trends online: For broader market trends like pet populations regionally, nationally, or globally, you can find a decent amount of data online. Resources like Euromonitor and Statistica can help.
- Financial reports: If your pet startup’s competitors are public companies, it's perfectly fine to have a peek at their financial reports to gather some basic data. However, if you use a market opportunity number from a different company, always credit the source in your pitch deck.
- Real life customers: The best data is your own. By speaking to real customers, you can get a good picture of what people want and how much they are willing to pay. This tangible data is also more impressive to potential investors than estimates.
- Consultants: You can hire market research specialists or consultants in the pet care industry to help you make more accurate projections for your pet startup.
Drawing from a combination of these sources will give you the best portrait of your specific market opportunity.
Determining market size: The missing piece that pet startups overlook
Now that we’ve talked about these numbers and their importance, the one thing pet startups miss is this:
Your TAM, SAM and SOM mean nothing without a solid marketing strategy.
Sure, these numbers signify the potential of your business, but potential does not equate to success, and investors know that.
Make sure that you understand your ideal customer avatars inside and out so you can present a competent plan to conquer your market.